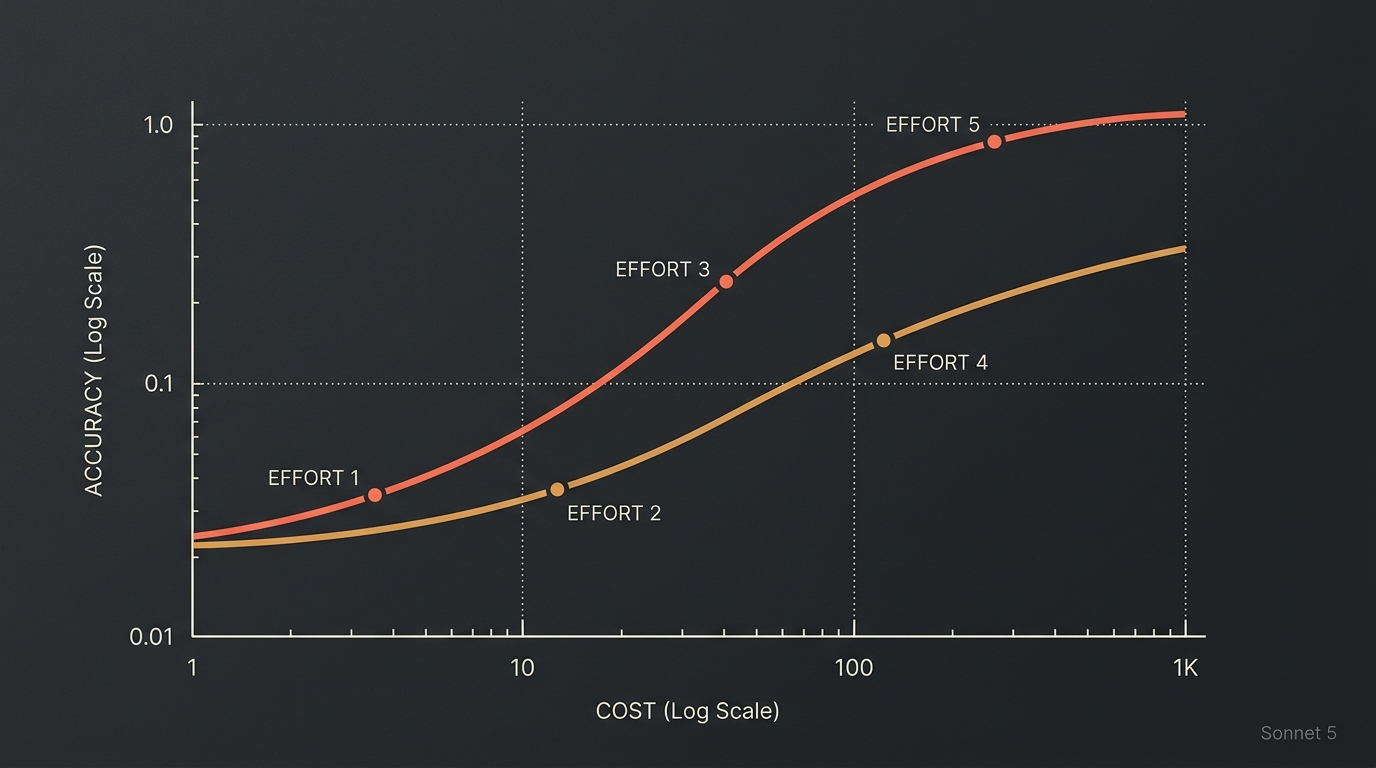
Claude Sonnet 5 came out today, June 30, 2026.
And you already know what's going to happen in your feed over the next few hours.
A screenshot of the benchmark table. "Sonnet 5 scores 80% on such-and-such." An excited caption. Zero context.
The problem isn't the number.
The problem is that a number on its own tells you nothing about your work. Not if you use Sonnet inside Claude Code, and not if you integrate the model into a product.
So let's do this differently. I'm going to take the benchmarks that Anthropic published in the official announcement, show you how to read each one, and translate them into practical decisions: when Sonnet 5 gets the job done, when you still need Opus, and how much that costs per task.
This isn't hype. It's engineering.
First, the official table
Anthropic put Sonnet 5 side by side with its predecessor (Sonnet 4.6) and with its pricier sibling (Opus 4.8, listed "for reference"):
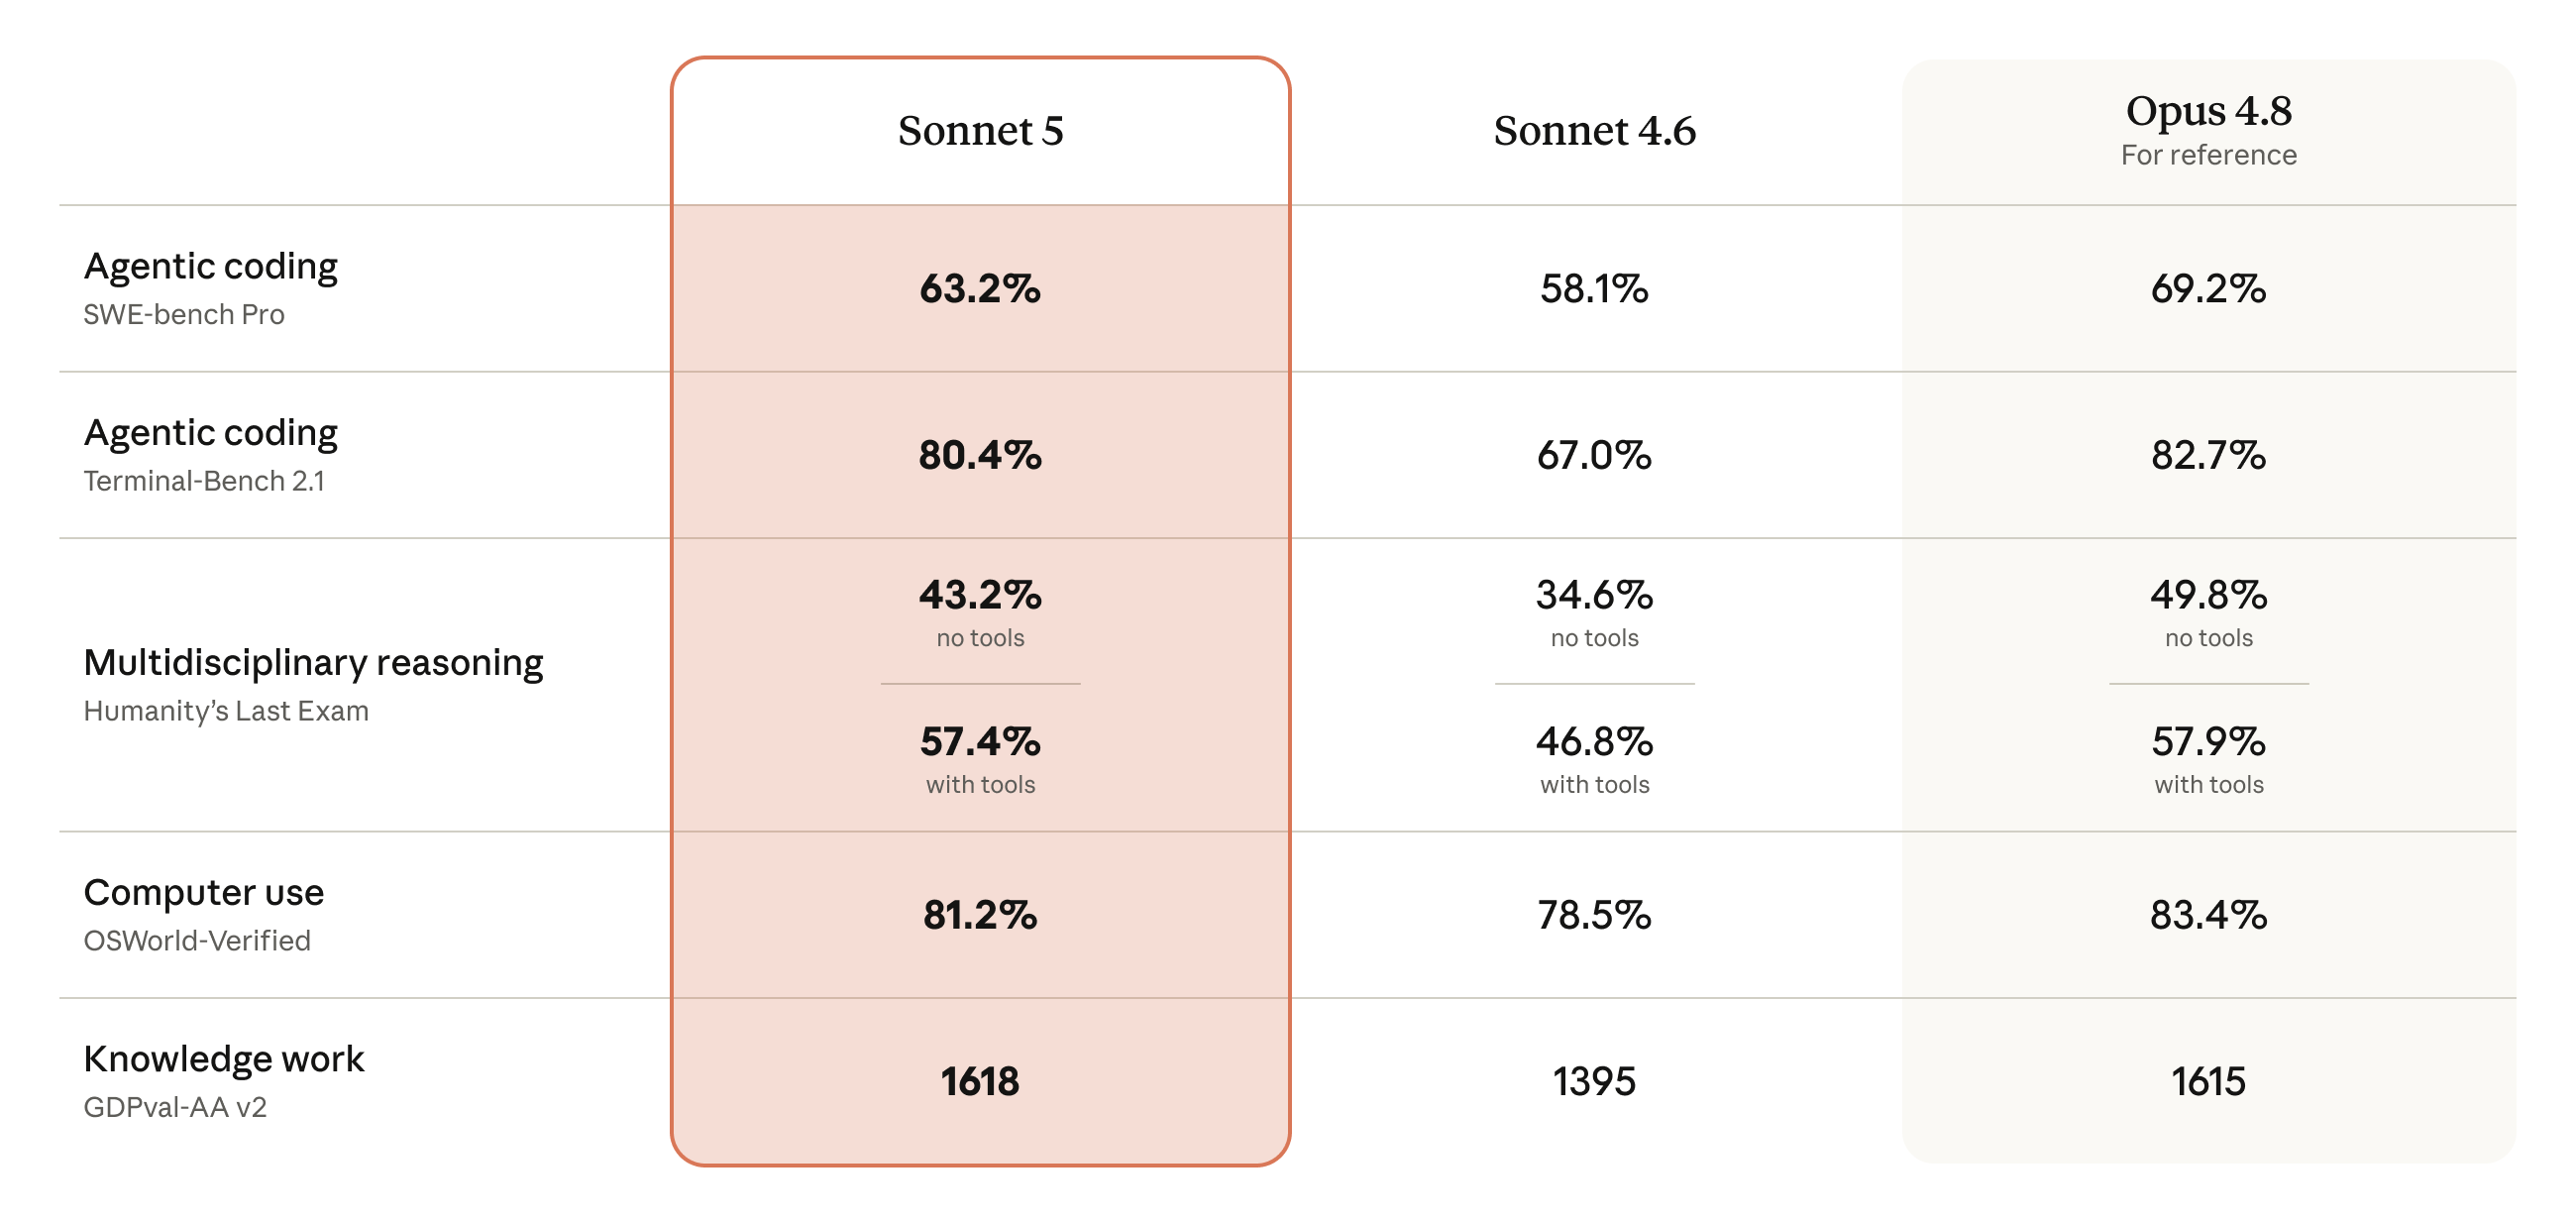
Here's the table as text, because the numbers are what matter:
| Benchmark | What it measures | Sonnet 5 | Sonnet 4.6 | Opus 4.8 |
|---|---|---|---|---|
| SWE-bench Pro | fixing a real bug/PR in a repo | 63.2% | 58.1% | 69.2% |
| Terminal-Bench 2.1 | working in the terminal, running CLIs | 80.4% | 67.0% | 82.7% |
| Humanity's Last Exam (no tools) | pure reasoning, no tools | 43.2% | 34.6% | 49.8% |
| Humanity's Last Exam (with tools) | reasoning with search/execution | 57.4% | 46.8% | 57.9% |
| OSWorld-Verified | using the computer (mouse, screen, apps) | 81.2% | 78.5% | 83.4% |
| GDPval-AA v2 | "office" knowledge work | 1618 | 1395 | 1615 |
Before any closer reading, three things jump out:
- Sonnet 5 crushes 4.6 on almost everything. The jump on Terminal-Bench (67% → 80.4%) and on GDPval (1395 → 1618) is big.
- It gets close to Opus 4.8 on several axes. And on GDPval-AA v2 it beats Opus (1618 versus 1615).
- On "hard" coding (SWE-bench Pro), Opus still has a margin: 63.2% versus 69.2%.
Hold on to those three. Now comes the part nobody shows you.
The axis missing from every screenshot: cost
Here's the most common reading mistake. People look at the accuracy number and ignore how much it cost to get there.
Anthropic itself published the charts the right way: accuracy on the Y axis, cost per task on the X axis (log scale). And there's more: each model shows up as a curve, not a point. Each dot is an effort level: low, medium, high, xhigh, max.
Look at the agentic search one (BrowseComp):
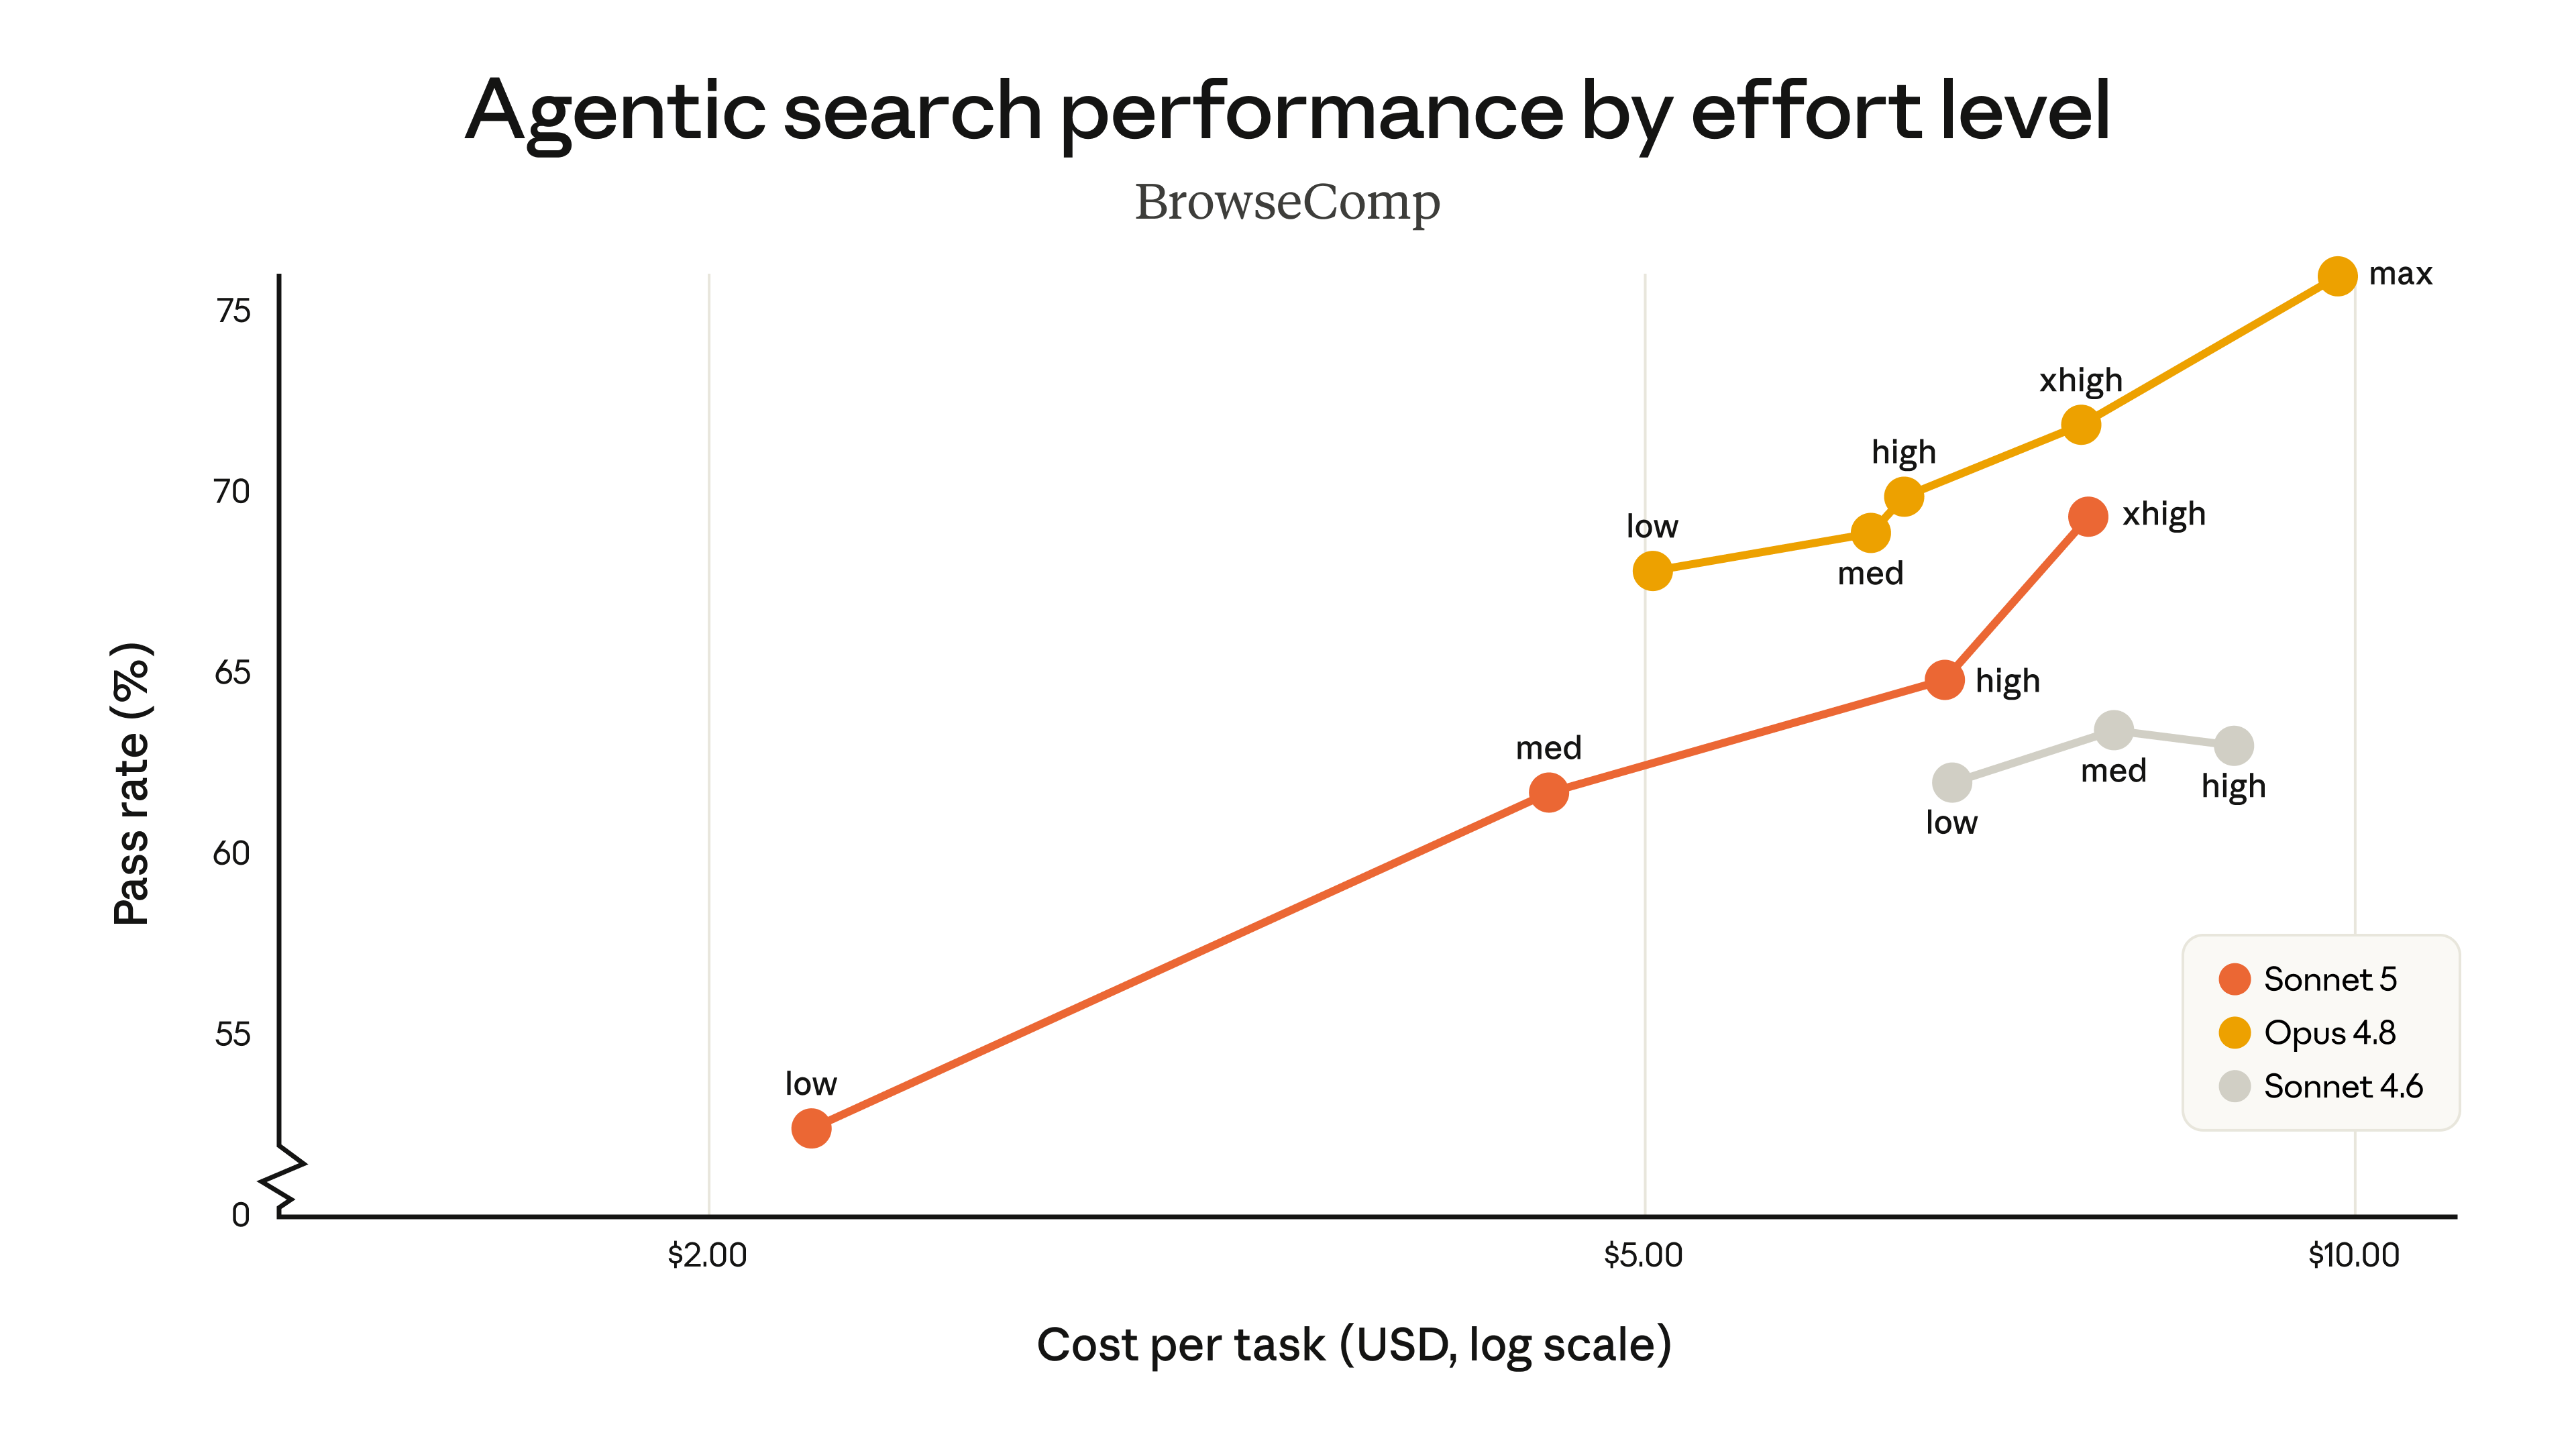
Read it like this: you don't pick "Sonnet 5." You pick a point on the Sonnet 5 curve. At low effort, it solves less but costs next to nothing per task. Moving up to high and xhigh, it gets more right and spends more. The entire Sonnet 5 curve (orange) sits below and to the left of the Opus curve (yellow), meaning cheaper for the same accuracy, and above the Sonnet 4.6 curve (gray) the whole way.
Same pattern on computer use (OSWorld-Verified):
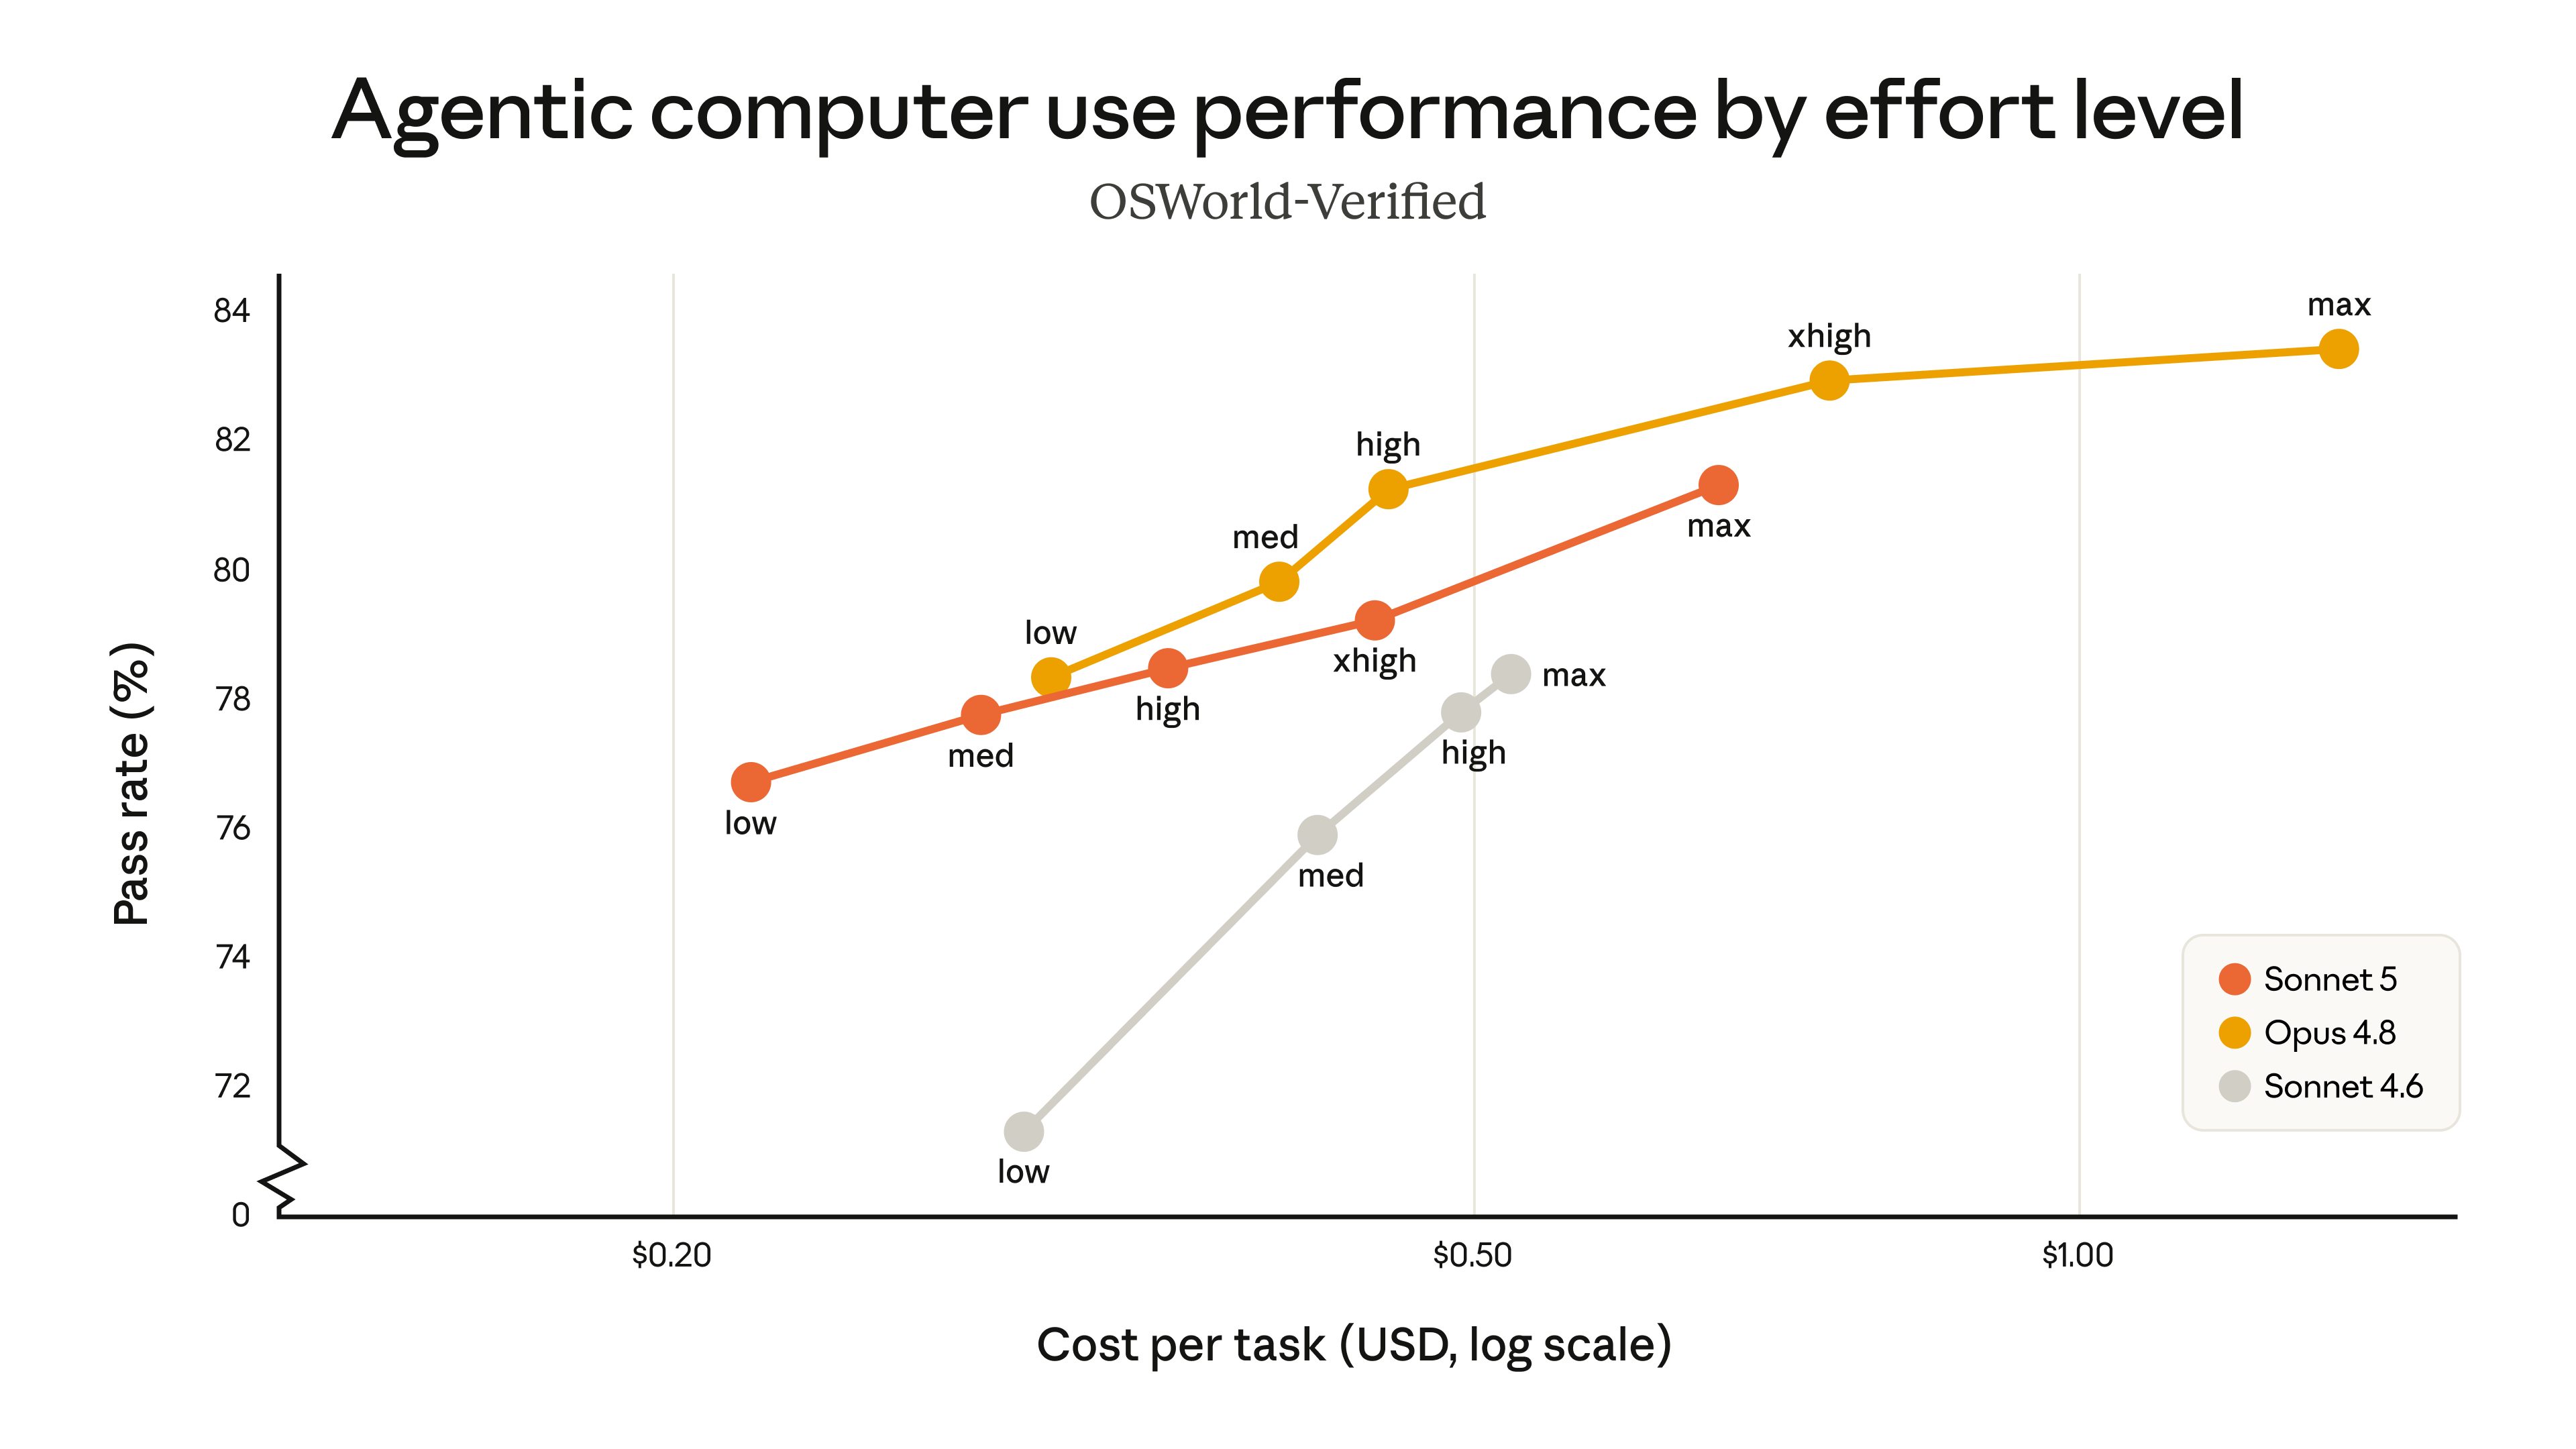
Notice that Sonnet 5 at low (around $0.21 per task) already beats Sonnet 4.6 at max (around $0.50). Same axis, half the cost, higher accuracy.
That's what "better model" actually means. It's not "it went up X points." It's: the entire cost-versus-accuracy curve moved to a better place. For every level of quality you need, you now pay less.
Anyone who only reads the peak number is looking at one dot on a curve and throwing the rest away.
SWE-bench Pro and Terminal-Bench measure different things
These two show up together under "agentic coding," but they aren't the same thing, and the difference matters for your day-to-day.
SWE-bench Pro takes a real bug or pull request from an open source repository and asks: can the model, on its own, understand the issue, find the files, write the patch, and pass the tests? It's the task closest to "close this ticket for me end to end." It's the hardest one, hence the 63.2%, well below the other benchmarks.
Terminal-Bench measures a different skill: operating in the terminal. Running a command, reading the output, chaining CLI tools, finding its way around a shell. It's the mechanics of the agentic loop, not the reasoning about the code itself. Hence the high number, 80.4%.
Why does separating them matter? Because a model can be great at the terminal and mediocre at fixing the bug: it beautifully executes the wrong steps. When you compare models for agentic coding, these two axes tell different stories, and the winner changes depending on the scenario. Looking at just one of them is like judging a driver only by speed, ignoring whether they got to the right address.
Do not just follow the news — master it. Hands-on AI Engineering, live, every week, in the largest community in Brazil.
Join the Clã"With tools" vs "no tools": the number that matters if you integrate
Look at the Humanity's Last Exam row again. Sonnet 5: 43.2% with no tools, 57.4% with tools.
A fourteen-point difference. Same model, same questions. The only change is giving it search and code execution.
This is the most important metric for anyone building a product with AI, and the most ignored.
Because the model "in a vacuum" (just weights, nothing plugged in) is not what you put in production. In production it has RAG, it has function calling, it has access to your database, your API, your documentation. The "with tools" column is the one that looks like your real system.
Practical lesson: when you're choosing a model for an agent, the "no tools" benchmark is close to folklore. What predicts your product's behavior is "does the model know how to use the tools that I give it?" And that's exactly the axis where Sonnet 5 made its biggest jump over 4.6 (46.8% → 57.4%).
If your AI architecture doesn't give the model good tools, you're running it in the wrong column of the table, and blaming the model for what is really a limitation of your harness.
What Sonnet 5 changes in Claude Code in practice
This is where theory turns into hands-on work.
Claude Code exposes exactly what those charts show: you control the model's effort level. It's the same low/medium/high/max scale as the curves above. It's not a config nicety. It's the knob that moves you along the cost-accuracy curve.
With Sonnet 5, this gets more interesting for a simple reason: its entire curve is better. In practice:
- Mechanical task (renaming, tweaking a test, touching config, writing boilerplate): Sonnet 5 at low effort. According to the charts, it delivers at
low/mediumwhat 4.6 only delivered athigh. You spend fewer tokens and finish faster. - Reasoning task (understanding a nasty bug, refactoring carefully, planning a feature): raise the effort. You move right along the curve, pay more per task, and accuracy follows.
- Sonnet 5 becomes the honest default. Before, for a lot of serious work you jumped straight to Opus. Now Sonnet 5 covers a good chunk of the way at a fraction of the cost, and the introductory pricing helps: $2 per million input tokens and $10 per million output tokens through August 31, 2026 (after that it goes up to $3 / $15).
When is Opus 4.8 still worth it? Where the margin is real: SWE-bench Pro (69.2% versus 63.2%) and pure reasoning with no tools (HLE 49.8% versus 43.2%). Translation: a genuinely hard bug in code, or heavy reasoning without the crutch of tools. For the rest of the everyday Claude Code workflow, Sonnet 5 holds up, and that "which model for which task" decision is half the game of not turning an agent into a money pit.
And if you integrate AI into a product
If you put Sonnet 5 behind an API, reading the benchmarks becomes an architecture and cost decision:
- OSWorld-Verified (81.2%) is the signal for agents that operate an interface: browser, apps, screen automation. Sonnet 5 is three points behind Opus here, at a much lower cost per task. For this kind of workload, it's the obvious cost-benefit choice.
- GDPval-AA v2 (1618) is "office work": reports, analysis, end-to-end knowledge tasks. It beat Opus 4.8 on this one. If your product is a work assistant, read this carefully: you don't need to pay for Opus to get Opus quality here.
- Do the math per task, not per token. The X axis on those charts is dollars per task, not per token, on purpose. A model that needs fewer back-and-forths to solve something can end up cheaper even with a similar token price. That's the metric that goes into your unit economics spreadsheet, not the benchmark's peak number.
- Give it real tools. Back to the HLE point: the "with tools" gain only shows up if your tools are good. Clear schema, honest description, lean return values. The model is half; the harness is the other half.
Anthropic also highlights that Sonnet 5 hallucinates and flatters less than 4.6, does a better job refusing malicious requests, and is more resistant to prompt injection, with the cyber safeguards on by default. For anyone putting this in front of real users, that's as much a "feature" as any benchmark point.
Wrapping up
New model launched? Great. But don't read a benchmark like a sports scoreboard.
An accuracy number alone doesn't tell you whether it's worth it for your case. What does is the whole curve: how much accuracy, at what cost, with which tools, on which task. SWE-bench Pro and Terminal-Bench measure different things. "With tools" is the column that looks like your production. And effort level is the knob you actually control, in Claude Code and in the API.
Sonnet 5 is, in the end, a curve shift: near-Opus quality on a big slice of the work, at a much lower cost. That changes your math more than any "X%" headline.
And if you want to go deeper on which model to use for which coding scenario, the side-by-side comparison of Claude Code, Cursor, and Copilot still holds. Now just swap Sonnet for version 5 and redo the math per task.

{AI Engineer} — apaixonado por Laravel, arquitetura de software e construir produtos com impacto. Compartilho aqui tutoriais, descobertas e reflexões sobre o dia a dia de engenharia.
There is no shortage of content. What is missing is someone to untangle it: what matters now is how to implement it the right way. In the Clã you get that live, every week, with people who have already filtered out the noise.
Join the Clã